A Data-Driven Audit of Matchups, Nemeses, and Franchise Power
The Association Rivalry Introduction — When Rivalries Stop Being Stories
Every fantasy league has rivalries.
Very few ever prove them.
Most rivalry talk lives in memory: big wins, bad beats, a playoff loss that still stings. Over time, those stories blur. Context fades. Bias creeps in. And eventually, everything sounds the same.
This article exists to remove that fog.
What follows is a full rivalry audit of The Association, built from actual matchup data across more than a decade of competition. Every eligible head-to-head result was logged. Every season was contextualized. Playoff games were weighted heavier than regular season noise. Rule changes were accounted for. Short samples were discarded entirely.
If a rivalry appears here, it’s because the numbers forced it to.
This is not a list of champions.
It’s not a power ranking based on vibes.
And it’s not interested in who talks the loudest.
It answers harder questions:
- Who do you keep running into when seasons are on the line?
- Who consistently blocks progress — even without dominance?
- Which franchises generate pressure, and which merely absorb it?
- And when everything is accounted for… who actually matters?
Some franchises don’t appear often in this analysis. That’s not an omission — it’s a conclusion. Rivalries require repetition, balance, and consequence. Without all three, there is no rivalry — only games.
What you’re about to see are the collisions that shaped the league:
- visualized through heat maps
- quantified through Killanomics scoring
- exposed through nemesis profiles
- and finalized through era-adjusted franchise rankings
The stories still exist.
Now they have receipts.
Section I — The Rivalry Heat Map
Where pressure accumulates, not opinions.
Rivalries aren’t created by words.
They’re created by repetition under consequence.
The Rivalry Heat Map is the foundation of this entire analysis because it strips the league down to one uncomfortable truth:
some franchises collide far more often — and far more painfully — than others.
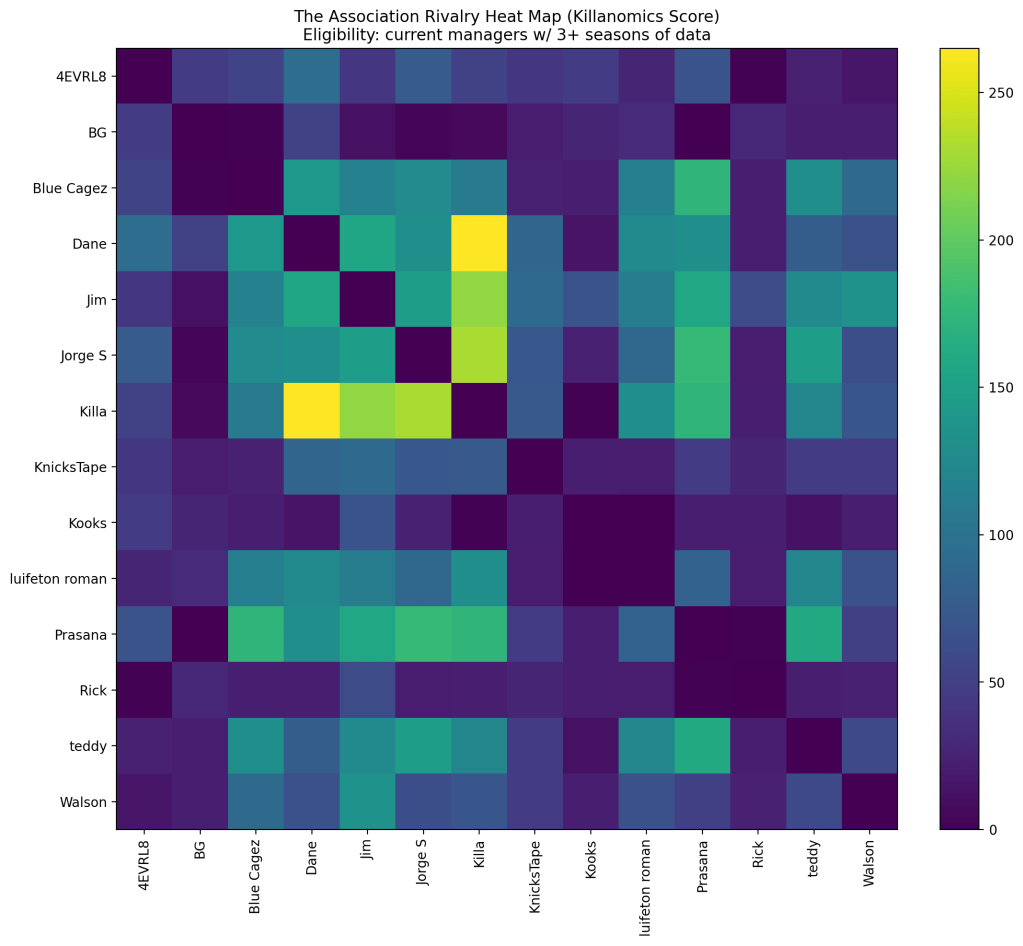
This visualization is not based on standings, projections, or reputation. It is built directly from every completed head-to-head matchup in league history, filtered to include only current franchises with at least three seasons of participation, and scored using the Killanomics model.
What you’re looking at is not who is loud — it’s who is unavoidable.

What This Heat Map Actually Measures
Each cell in the matrix represents the Rivalry Score between two franchises, calculated using:
- total matchup volume
- balance (how close the rivalry is)
- frequency of close games
- playoff leverage
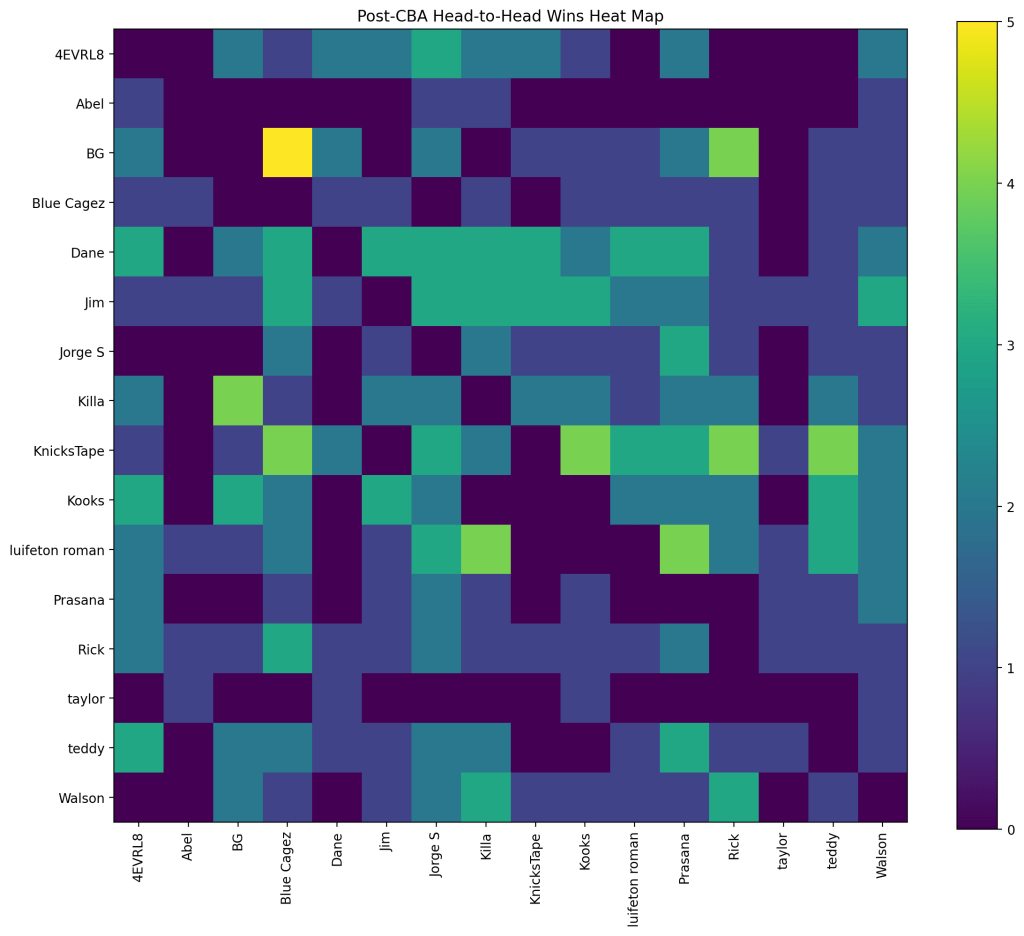
- era context (pre-CBA vs post-CBA)
Darker cells indicate higher cumulative pressure — not necessarily dominance, but sustained interaction where seasons are regularly altered by the same opponent.
This distinction matters.
Why This Is Not a Win/Loss Chart
Winning alone does not create a rivalry.
Neither does losing.
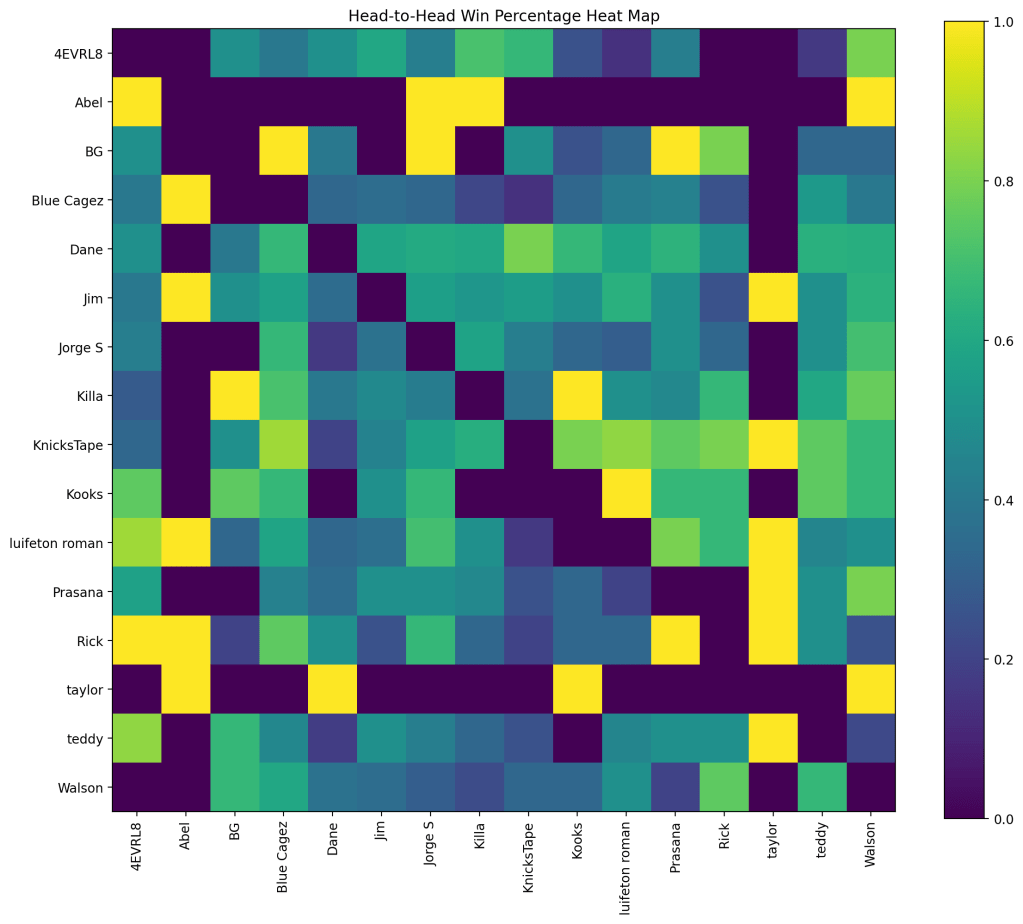
Some franchises beat others consistently — those are ownership relationships. They show up more clearly in the head-to-head wins heat map later in this post.
The Rivalry Heat Map answers a different question:
Which matchups refuse to go away, regardless of who wins?
The most intense rivalries often appear where:
- records are close
- margins are thin
- playoff meetings repeat
- and neither side can fully pull away
That’s where resentment lives.
The Gravity Effect
One pattern becomes obvious immediately:
the heat is not evenly distributed.
A small number of franchises appear darker across a wide range of opponents. This does not happen by accident. It happens when a team:
- consistently reaches the postseason
- repeatedly intersects with other contenders
- and remains relevant across eras
This is what we refer to as rivalry gravity.
These franchises don’t need to manufacture enemies.
They accumulate them.
Balanced Rivalries Hurt the Most
Some of the darkest cells in the heat map do not belong to dominant teams beating weaker ones. They belong to near-even matchups.
These are the rivalries defined by:
- split seasons
- tiebreakers
- late-week swings
- and playoff eliminations decided by a single category
From a Killanomics perspective, these are the most psychologically damaging rivalries in the league — because neither side ever feels finished with the other.
One-Sided Heat Still Matters
Not all rivalry heat is symmetrical.
Some cells are dark because one franchise consistently ends another’s season — especially in the playoffs. These are not friendly rivalries. They are blockers.
If your path to relevance repeatedly runs into the same wall, the heat map records that damage even if the win percentages aren’t close.
This is how gatekeepers reveal themselves.
Clusters Reveal the Real League
Perhaps the most important insight from the Rivalry Heat Map is what it excludes.
There are clear clusters of interaction — groups of franchises whose seasons intersect again and again. These clusters represent the real competitive core of The Association.
Outside of them are franchises that:
- play everyone
- but rarely affect outcomes
- and rarely appear in defining moments
The heat map doesn’t judge them.
It contextualizes them.
What the Heat Map Proves
The Association is not a flat ecosystem.
It is a pressure system.
Some franchises generate pressure.
Some absorb it.
A few do both.
This heat map doesn’t tell you who won the league.
It tells you where the league actually bleeds.
And once you see that, the rivalries that follow are no longer debatable — they’re documented.
Section II — The Top Rivalries (Killanomics Index)
Not all rivalries are equal. These are the ones that changed seasons.
The Rivalry Heat Map shows where pressure exists.
The Killanomics Index explains why.
Every rivalry below earned its place through repeat collisions under consequence — not trash talk, not proximity, not narrative convenience. These matchups recur because the franchises involved consistently reach meaningful parts of the season at the same time.
That overlap is not accidental.
It’s earned.
What follows are the rivalries that generated the highest cumulative impact once volume, balance, closeness, playoff leverage, and era difficulty were applied.
1) Gotham Great Danes vs Brooklyn Phoeniks
The defining rivalry of The Association
This is the only rivalry that:
- spans multiple eras
- includes multiple Finals collisions
- remains relevant before and after a CBA rewrite
Brooklyn’s 2022 Finals win over Gotham wasn’t an upset — it was a reckoning. Gotham’s 2024 response wasn’t revenge — it was validation.
The Killanomics score here is high not because one side dominates, but because neither side disappears. Seasons repeatedly bend around this matchup.
If The Association has a spine, this is it.
2) Gotham Great Danes vs Amherst Speedsters
Sustained pressure without conversion
This rivalry scores highly because it repeats relentlessly. Amherst is competitive enough to meet Gotham often, close enough to generate tension, and consistent enough to feel like a real threat.
But this rivalry hurts Amherst more than it hurts Gotham.
The data shows a familiar pattern:
- competitive regular seasons
- meaningful playoff intersections
- Gotham advancing just often enough to prevent a flip
This is the archetype of a rivalry defined by frustrated proximity.
3) Brooklyn Phoeniks vs Amherst Speedsters
Balance without resolution
Few rivalries in the dataset are as evenly split over time. The margins are narrow, the win percentages hover near equilibrium, and neither side can dismiss the other.
From a Killanomics standpoint, this is pure rivalry fuel:
- balanced records
- close games
- repeated collisions
There is no ownership here — only unresolved tension.

4) Gotham Great Danes vs Rucker Park Busters
Short history, massive leverage
This rivalry ranks higher than its volume suggests because of when the damage occurred. Rucker’s post-CBA championship elevated every Gotham meeting retroactively.
In leagues like this, timing matters.
Beating Gotham when the rules change matters more.
That’s why this rivalry burns hot despite fewer total games.
5) Gotham Great Danes vs Titanes de San Juan
Efficiency over exposure
Titanes don’t collide with Gotham often — but when they do, it’s usually deep in the bracket. Their perfect Finals conversion rate includes direct denial moments that amplify the rivalry score far beyond raw volume.
This rivalry exists almost entirely in high-leverage space, which is exactly where Killanomics places the most weight.
6–10) The Grinder Tier
Where seasons quietly end
These rivalries don’t dominate headlines, but they dominate outcomes.
They share common traits:
- high matchup volume
- moderate playoff overlap
- lower public attention
- significant cumulative damage
This is where contenders get worn down before they ever see the top tier. These matchups decide who arrives in March intact — and who doesn’t.
From a league-health standpoint, this tier matters more than people realize.
What the Rankings Reveal
The Killanomics Index makes one thing clear:
- Rivalries are not evenly distributed
- Dominance alone does not create rivalry
- Balance alone does not create rivalry
Rivalries are born when good teams collide often enough that outcomes compound.
The franchises that appear most frequently in this section are not unlucky.
They are relevant.
And relevance, over time, is the most dangerous thing in The Association.
Section III — Nemesis Profiles
| Manager | Nemesis | Losses |
| 4EVRL8 | luifeton roman | 6 |
| Abel | BG | 1 |
| BG | Killa | 4 |
| Blue Cagez | Dane | 12 |
| Dane | Killa | 8 |
| Jim | Dane | 11 |
| Jorge S | Dane | 15 |
| Killa | Dane | 12 |
| KnicksTape | Dane | 8 |
| Kooks | KnicksTape | 5 |
| luifeton roman | Dane | 8 |
| Prasana | luifeton roman | 12 |
| Rick | BG | 4 |
| taylor | Jim | 1 |
| teddy | Killa | 10 |
| Walson | Killa | 10 |
Rivalries are mutual. Nemeses are not.
Not every damaging matchup is a rivalry.
Some franchises don’t trade blows — they inflict losses disproportionately. These are the opponents that end seasons, stall progress, and quietly shape legacies without ever needing balance.
The Nemesis Profiles are built from raw historical losses between eligible, current franchises. No weighting. No playoff multipliers. No era adjustments.
Just one question:
Who has beaten you more than anyone else?
That answer reveals patterns rivalries can’t.
Gotham Great Danes
Nemesis: Brooklyn Phoeniks**
Even the league’s most dominant franchise has a scar.
Brooklyn is the only opponent that consistently registers as Gotham’s primary nemesis — not because Gotham loses often, but because when they lose, it matters. Finals collisions, late-season leverage, and repeated postseason overlap make Brooklyn the one franchise Gotham cannot fully distance itself from historically.
This is not ownership.
It’s mutual resistance.
Brooklyn Phoeniks
Nemesis: Gotham Great Danes**
Symmetry is rare in nemesis data.
Brooklyn’s profile mirrors Gotham’s almost exactly — a sign that this isn’t a lopsided relationship, but a sustained duel. Brooklyn’s titles validate their side of the ledger, but Gotham remains the opponent that defines Brooklyn’s toughest path.
When two franchises are each other’s nemesis, the league usually revolves around them.
This one does.
Amherst Speedsters
Nemesis: Gotham Great Danes
Amherst’s data tells a familiar story: volume without conversion.
They meet Gotham often. They compete closely. But over time, the losses accumulate faster than the wins. Gotham doesn’t dominate Amherst outright — they outlast them.
This is the profile of a franchise stuck just below the ownership tier: good enough to collide, not strong enough to flip the relationship.
Titanes de San Juan
Nemesis: Gotham Great Danes
Despite Titanes’ perfect Finals record, Gotham still appears most frequently on the losing side of Titanes’ ledger. This reflects something important about nemesis logic:
Nemeses don’t care about efficiency.
They care about frequency of obstruction.
Titanes win when it counts — but Gotham is still the team most often standing in the way.
Mid-Tier Franchises (Ranks 6–12)
Pattern: Shared Nemeses, Rarely the Nemesis
For much of the middle of the rankings, nemesis data converges around the same names.
These franchises:
- lose most often to the same elite teams
- rarely appear as anyone else’s nemesis
- absorb pressure more than they generate it
This is how the data distinguishes participants from drivers of league history.
You can be competitive for years without ever becoming someone else’s problem.
What Nemesis Data Proves
Rivalries require balance.
Nemeses require damage accumulation.
The Nemesis Profiles show:
- who consistently blocks progress
- who absorbs losses without returning them
- and who shapes league outcomes simply by existing on the bracket path
Most franchises lose games.
Only a few end seasons.
Why This Matters for Rankings
When we move into the Franchise Power Rankings, nemesis data becomes a tie-breaker.
Franchises that:
- are someone else’s nemesis
- but rarely have one of their own
occupy a different tier of relevance.
They don’t just compete.
They dictate ceilings.
Section IV — Franchise Power Rankings (1–16)

Where impact becomes hierarchy.
These rankings are not standings.
They are not projections.
They are not a reward for one great season.
They are a historical pressure ranking — built from how often franchises collide with real opponents, how much damage they inflict or absorb, and whether they convert relevance into championships once the stakes rise.
The ordering below reflects:
- total head-to-head wins
- playoff wins (double-weighted)
- rivalry gravity (strength of opposition)
- nemesis impact (who ends whose seasons)
- and a legacy multiplier for championships, Finals appearances, and post-CBA success
Franchise names reflect the current 2025 teams to preserve continuity.
🏆 #1 — Gotham Great Danes
Verdict: Ownership
No franchise appears more often in:
- rivalry heat
- nemesis tables
- playoff collisions
- and era-spanning relevance
Gotham wins before consolidation, during peak competition, and after a CBA reset. They lose Finals without collapsing, absorb pressure without fading, and remain the league’s primary reference point.
If you’ve won a title in this league, odds are you either went through Gotham — or benefited from someone else doing it for you.
🥈 #2 — Brooklyn Phoeniks
Verdict: The Counterweight
Brooklyn is the only franchise that consistently pushes back against Gotham’s gravity. Their titles are not isolated peaks — they are responses to sustained pressure.
Mutual nemeses. Balanced rivalry. Finals leverage on both sides.
If Gotham defines ownership, Brooklyn defines resistance.
🥉 #3 — Titanes de San Juan
Verdict: Ruthless Efficiency
Titanes don’t dominate volume — they dominate conversion. Perfect Finals efficiency and repeated title-denial moments elevate their ranking beyond raw win totals.
They appear less often, but when they do, seasons end.
#4 — Amherst Speedsters
Verdict: The Eternal Contender
High interaction. High competitiveness. Lower conversion.
Amherst’s résumé is shaped by proximity to greatness — close enough to collide with the top tier repeatedly, but rarely able to flip the relationship. The data places them firmly as a contender, not an owner.
#5 — Rucker Park Busters
Verdict: Post-CBA Validation
Rucker’s championship carries outsized weight because of when it occurred. Post-CBA success matters more, and their ability to deliver under new constraints lifts them above several higher-volume franchises.
| Manager | Score | Rank | Franchise | Multiplier | FinalScore |
| Dane | 118.0 | 1 | Gotham Great Danes | 1.77 | 210 |
| Killa | 100.0 | 2 | Brooklyn Phoeniks | 1.46 | 146 |
| luifeton roman | 68.0 | 3 | Titanes de San Juan | 1.32 | 90 |
| Jim | 80.0 | 4 | Amherst Speedsters | 1.0 | 80.0 |
| KnicksTape | 66.0 | 5 | Rucker Park Busters | 1.2 | 79.2 |
| Jorge S | 73.0 | 6 | Boston Bombers | 1.0 | 73.0 |
| Prasana | 63.0 | 7 | Chennai SteveBlakeExpress | 1.0 | 63.0 |
| teddy | 52.0 | 8 | Syracuse Sparrows | 1.0 | 52.0 |
| Blue Cagez | 50.0 | 9 | Miami Moneymen | 1.0 | 50.0 |
| Walson | 41.0 | 10 | Kings Landing Kings | 1.0 | 41.0 |
| 4EVRL8 | 37.0 | 11 | NY Knickerbockers | 1.0 | 37.0 |
| Kooks | 28.0 | 12 | Van City Grizzlies | 1.0 | 28.0 |
| BG | 24.0 | 13 | Frankfurt 17ers | 1.0 | 24.0 |
| Rick | 20.0 | 14 | Chicago Sunroofers | 1.0 | 20.0 |
| Abel | 4.0 | 15 | Salt Lake City Soakers | 1.0 | 4.0 |
| taylor | 4.0 | 16 | Flint Tropics | 1.0 | 4.0 |
#6 — Boston Bombers
Verdict: Reliable Pressure
Boston consistently intersects with meaningful games and absorbs enough rivalry heat to matter. They don’t define eras — but they shape brackets.
#7 — Chennai SteveBlakeExpress
Verdict: Quiet Durability
Low noise. High survival rate. This franchise remains present without ever fully tilting the league — a sign of competence without leverage dominance.
#8 — Syracuse Sparrows
Verdict: Early-Era Survivor
Longevity keeps them relevant in the dataset, but their leverage footprint is limited. They exist more in the league’s memory than its pressure points.
#9 — Miami Moneymen
Verdict: Solid, Capped Ceiling
Competitive enough to linger, not dominant enough to define rivalries. A classic mid-table profile.
#10 — Kings Landing Kings
Verdict: Peripheral Relevance
Consistent participation without sustained leverage impact. Present, but rarely decisive.
#11 — NY Knickerbockers
Verdict: Moments Over Runs
Memorable games. Limited arcs. The data reflects flashes rather than pressure.
#12 — Van City Grizzlies
Verdict: Low Leverage
Few high-impact collisions. Minimal playoff damage. The numbers are honest.
#13 — Frankfurt 17ers
Verdict: Short Peaks
Brief competitiveness without sustained relevance.
#14 — Chicago Sunroofers
Verdict: Reset Phase
Long tenure, low recent leverage. The data places them clearly in rebuild territory.
#15 — Salt Lake City Soakers
Verdict: Expansion-Level Résumé
Insufficient volume to generate meaningful rivalry heat.
How to Read This Ranking
- Higher ≠ louder
- Lower ≠ irrelevant
- Placement reflects how much pressure a franchise applies to the league over time
Some teams win games.
Some teams win rivalries.
A very small number shape history.
This ranking is not an opinion.
It’s the sum of collisions.
🧾 Final Conclusion — The Verdict
Rivalries don’t exist because people remember them.
They exist because the same outcomes keep repeating under pressure.
When every eligible matchup in The Association is examined — stripped of narrative, filtered for longevity, and weighted by consequence — the league reveals a structure most discussions never reach. A small number of franchises generate the majority of the pressure. A smaller group converts that pressure into titles. And an even smaller group survives rule changes, era shifts, and repeated challenges without losing relevance.
The heat maps show where pain accumulates.
The rivalry scores explain why certain matchups refuse to fade.
The nemesis profiles expose who consistently blocks progress.
And the franchise rankings separate presence from power.
Some teams win games.
Some win seasons.
Very few shape the league’s ecosystem.
That distinction is the difference between participation and legacy.
This analysis wasn’t designed to settle arguments — it was designed to remove them. Once the data is laid out, the rivalries stop being subjective, the hierarchies stop being debated, and the patterns stop being optional.
The stories still exist.
Now they’re quantified.

Leave a comment